Upper-division coursework / experimental analysis
Modern Physics
Laboratory Analysis
A technical portfolio of nuclear, quantum, condensed-matter, and optical experiments that connects real instrumentation to calibrated data, model fitting, uncertainty, and formal reporting.
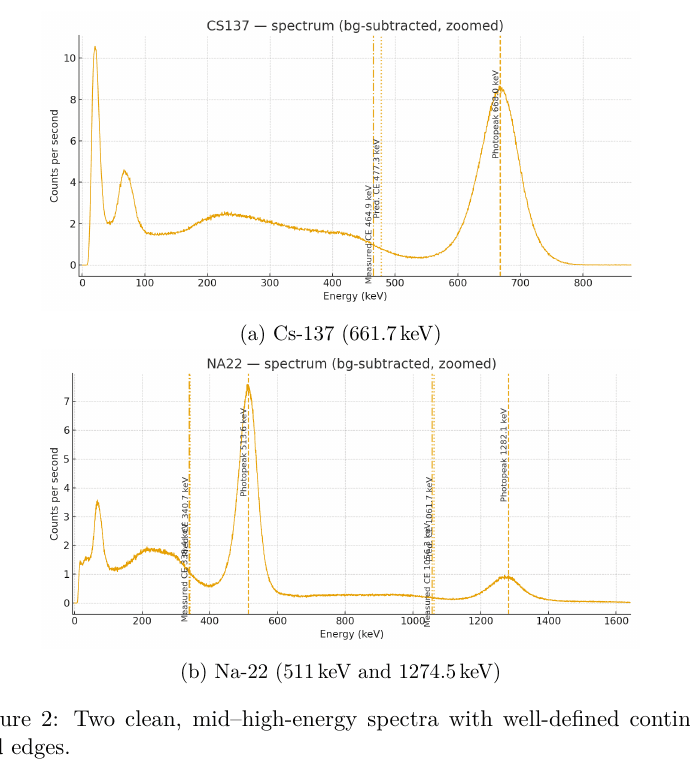
These reports combine experimental measurements with numerical analysis, uncertainty estimates, and formal technical writing.
Across the labs, I worked with scintillation detectors, spectroscopy electronics, multichannel data, programmable voltage sweeps, picoammeter measurements, temperature sensing, an electron-diffraction tube, and oscilloscope-based pulse timing. The common task was to convert imperfect instrument output into a result that could be compared honestly with a physical model.
The collection is presented as coursework-based experimental analysis. Its value is in the analysis chain: calibration, processing, fitting, uncertainty, model checking, and clear communication of where the data did and did not support a conclusion.
Case studies
Nuclear decay, gamma scattering, semiconductor transport, electron diffraction, and the speed of light.
Gamma sources
Spectra spanning low- to high-energy detector-response regimes.
Device materials
Silicon and germanium junction behavior compared across temperature.
Analysis principle
Use the model only where its assumptions remain physically credible.
Ba-137m half-life
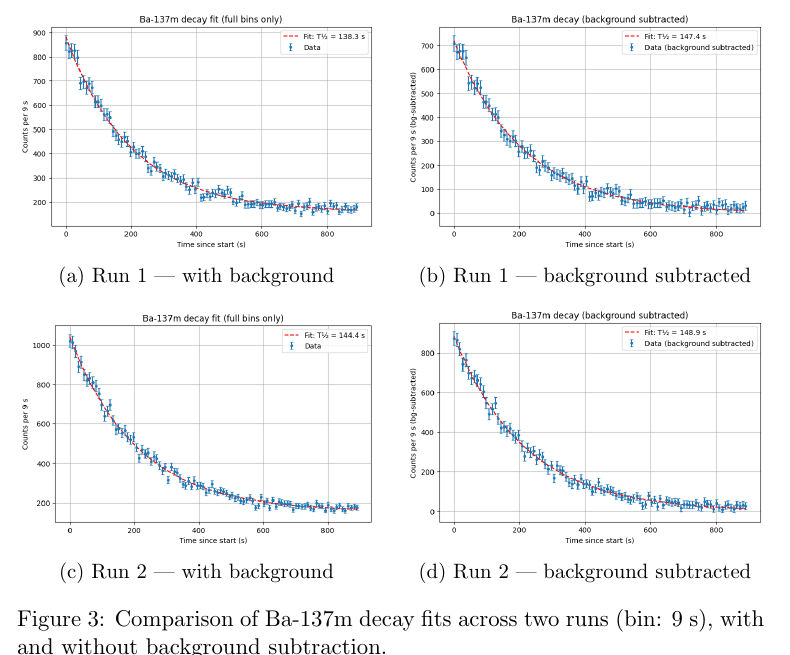
Measured a short-lived nuclear decay curve and tested how explicit background treatment changes the fitted half-life.
Scintillation counting / SCA windowing / 9 s rebinning / weighted nonlinear least squares
Two background-subtracted fits gave 147.4 +/- 3.2 s and 148.9 +/- 2.9 s, compared with the report's accepted value of 153.1 s.
Compton scattering & gamma spectroscopy
Processed spectra from seven gamma-emitting isotopes to identify photopeaks, detector widths, and Compton edges.
Live-time normalization / background subtraction / Gaussian and derivative-of-Gaussian filtering
The extracted mid- and high-energy continuum edges tracked the relativistic prediction within a few percent; low-energy resolution and gain drift limited the more difficult spectra.
Semiconductor thermal characterization
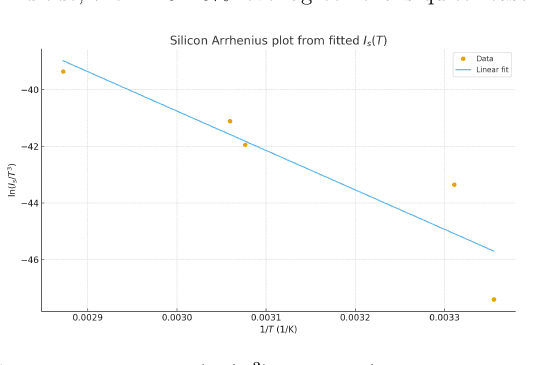
Compared silicon and germanium transistor junctions across temperature using I-V sweeps and physically selected fitting windows.
DAQ voltage sweeps / picoammeter readout / semilog fitting / model-validity checks
Silicon produced an effective band-gap estimate of 1.2 +/- 0.3 eV. Germanium showed why a high-R-squared fit can still be physically invalid when the selected regime violates the model assumptions.
Speed of light by time-of-flight
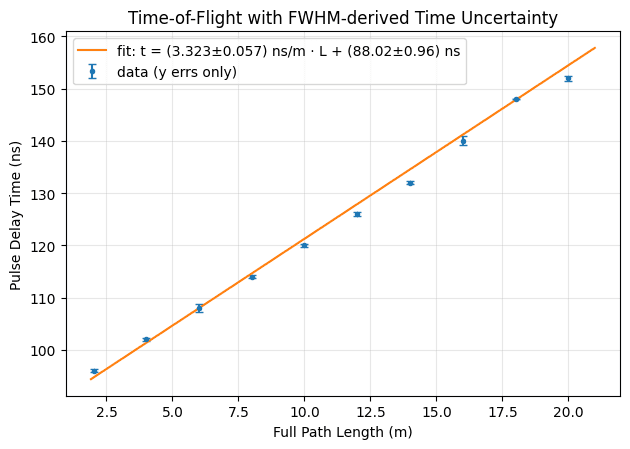
Measured the speed of light with a pulsed-laser time-of-flight setup, extracting c from the slope of round-trip distance against oscilloscope-measured pulse delay.
Pulsed laser diode / oscilloscope timing / FWHM pulse analysis / weighted linear regression
A linear fit of delay versus round-trip path gave c = (3.01 +/- 0.05) x 10^8 m/s, within about 0.5% of the accepted value; a lower-scatter second run sat roughly 3% high, a clean case of precision without accuracy.
Electron diffraction in graphite
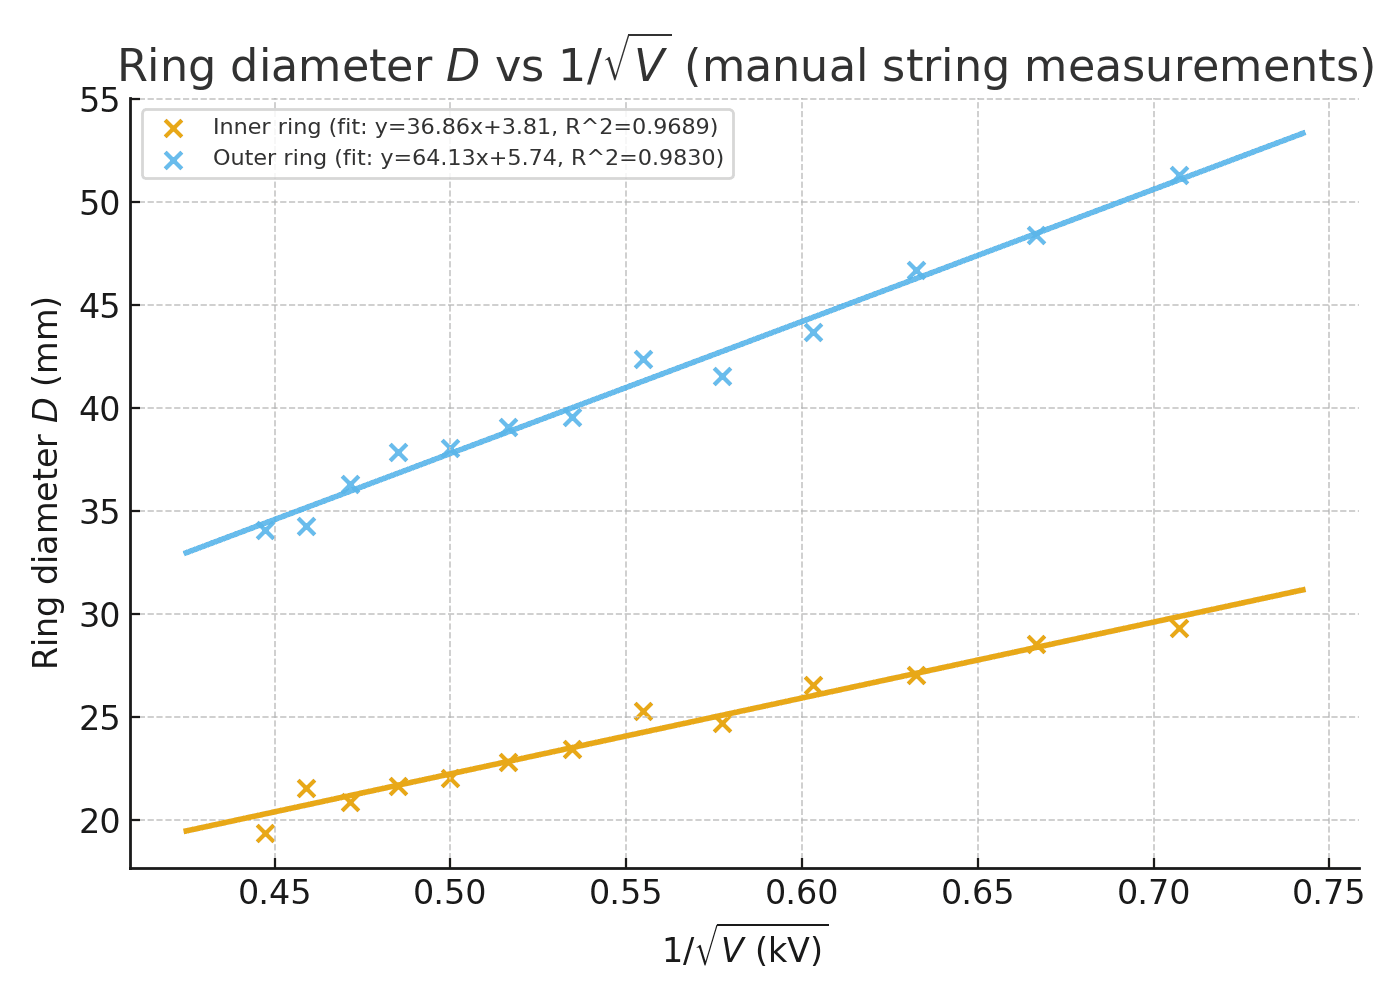
Measured the de Broglie wavelength of accelerated electrons from graphite diffraction rings, comparing a manual string method against an automated image-analysis pipeline.
Teltron diffraction tube / ring-radius extraction / azimuthal radial profiling / weighted least squares
Ring diameters scaled linearly with 1/sqrt(V) (R-squared >= 0.97 for both rings); the image channel tracked the relativistic de Broglie prediction to within about 0.3%, while the manual string method agreed to about 5%.
Instrumentation as a system
Detector, amplifier, analyzer, DAQ, and software settings were treated as one measurement chain whose calibration shaped the final result.
Calibration and data reduction
Raw counts and voltage sweeps became usable physical data through live-time normalization, background correction, rebinning, and energy or temperature calibration.
Model fitting with judgment
Exponential, semilog, and Arrhenius fits were paired with fit-window selection and physical consistency checks rather than accepted on a numerical score alone.
Uncertainty and limitations
Poisson statistics, covariance-based errors, propagation, detector resolution, gain drift, leakage, and series resistance were carried into the interpretation.
Technical communication
Each analysis was organized as a formal report connecting theory, apparatus, processing choices, figures, results, limitations, and references.
04 / My role
My role involved collecting and processing experimental data, producing analysis figures, fitting physical models, writing formal reports, and interpreting results within experimental limits.
The work included Python-based processing of exported CSV and spectroscopy files, background treatment, energy calibration, nonlinear and log-linear fitting, covariance or regression uncertainty, and deliberate checks for model validity. Apparatus setup and data collection were completed with lab partners; the reports identify those collaborations and the support of course staff.
Real measurements rarely follow an ideal model across the full operating range.
Calibration and uncertainty are part of the result, not supporting details.
A statistically clean fit is not automatically a physically meaningful fit.
Clear figures make analysis choices and limitations easier to review.
Experimental constraints determine how strong a conclusion can honestly be.